
A Short Monthly Pack That Shows Where Your Outlets Are Losing People and Money
Put sales, workshop and plant people data side by side with clear definitions, and report it in a pack that management reads. Our HR analytics and reporting service agrees what each measure means, sets up the monthly pack and the review meeting, and designs comparisons that allow for outlet size, mix and tenure. We do not invent the story. We show what the data says and what it cannot say.
Not sure what you need? Tell us about your business in six short steps and we will come to the first meeting prepared.
Share your requirementsThe starting point
Can You See Your People Data Next to Your Business Data?
Headcount sits with HR, revenue with finance and billed hours in the workshop system. When they are never shown together, questions about why one workshop earns less per technician than another cannot be answered, and each outlet argues from its own figures.
We help you agree the measures once, and report a few of them every month.
You may be experiencing:
- Headcount reported by HR and revenue by finance, with no link between them.
- Attended hours, billed hours and tenure never shown together, so a slow workshop may simply be a new one.
- Outlets of different size and mix set side by side as if they were alike.
- Attrition given as a single figure, with no view of who left, from where or after how long.
- Definitions that differ between outlets, so two reports for the same month disagree.
- Monthly packs so long that nobody reads past the first page.
- Overtime, vacancies and certification expiry known only when someone asks.
- Reports prepared by hand at month end, with the same errors each time.
What we can help with
Our HR Analytics and Reporting Services for Automotive
Measure Definitions
Write down what each measure means: headcount, attrition, absence, overtime, productive hours, vacancy age and cost per outlet, so that every outlet calculates it alike.
Headcount, Cost and Movement Reporting
Report headcount, joiners, leavers, transfers and employee cost by outlet and function, with a link to the plan.
Attendance and Absence Reporting
Show attendance, absence, late marks, overtime and weekly-off coverage by outlet and shift, with patterns that point to a rota problem and not to a person.
Hiring and Attrition Reporting
Report open vacancies and their age, offers and joinings, and attrition split by outlet, role, tenure and regretted or not.
Workshop and Sales Productivity Context
Place billed hours, attended hours, comebacks and sales per consultant beside tenure, bay count and mix, so that comparisons are fair.
Performance and Training Reporting
Report review completion, rating spread, certification status and training completion by outlet and role.
Monthly Pack and Dashboard Design
Design a short pack and, where wanted, a dashboard, with a single page for management and detail underneath for those who need it.
Review Meeting and Follow-Up
Set an agenda and rhythm for a monthly review, with an action list so that the pack leads to decisions.
The deliverables
What You Receive
Depending on scope, you receive:
- A measure definition sheet.
- A monthly HR pack with a one-page summary.
- Outlet comparisons that account for size, mix and tenure.
- An attrition report by outlet, role and tenure.
- A vacancy, overtime and certification-expiry view.
- A dashboard specification.
- A data source map showing where each figure comes from.
- A review meeting agenda and action log.
Step by step
How We Work
Ask What Decisions the Pack Serves
We ask managers which decisions they take each month and what they need to see to take them.
Agree Definitions
We settle the meaning of each measure and test it on past months.
Map the Data Sources
We trace each figure to its source in HR, finance, the workshop system or the plant, and note where it is unreliable.
Build the Pack
We assemble the pack and, where you wish, configure reports on the GullyHR platform or your own system.
Run Three Cycles
We support the first reporting months and the review meetings, adjusting the pack as questions arise.
Review the Pack
We ask what was read and what was ignored, and cut what nobody used. We note how long the pack takes to produce now, and report against that.
The difference
A Pack Management Actually Reads
Clear definitions and a short pack help you:
We do not promise outcomes. We record a baseline before work starts, covering the time taken to prepare the monthly pack, the number of measures reported and disagreements about figures, and report against it, so you can see what changed and what did not.
- See people and business numbers on one page.
- Compare outlets with allowance for size and mix.
- Ask who left, from where and after how long.
- Spot overtime, vacancy and certification problems early.
- Stop arguing about whose figure is right.
- Reduce the hours spent assembling reports by hand.
Find your fit
Who This Service Is For
Dealership Groups
Compare outlets of different size on a common basis.
Service Centres and Garages
See workshop productivity alongside attendance and tenure.
Manufacturers and Component Makers
Report attendance, absence, overtime and attrition by shift and line.
Fleet and Rental Companies
Report driver availability, attendance and cost by depot.
Owner-Led Businesses
Replace anecdotes with a one-page view each month.
Businesses Opening New Outlets
Track a new outlet's staffing, attrition and productivity against its plan from the first month.
How it usually shows up in automotive
A group needs to see sales, workshop and plant people data together and usually cannot. Headcount sits in HR and revenue in finance, so questions such as why service revenue per technician differs between outlets cannot be answered. Tenure, attended hours and billed hours are not shown together, so a slower workshop may simply be a newer one. Outlets of very different size and mix are set side by side. Attrition is a single figure that does not say who left, from where or after how long.
Common challenges
Where it goes wrong in automotive
People data and business data are separate
Headcount sits in HR and revenue sits in finance. Nobody joins them.
Tenure and productivity are not shown together
The slowest technicians may be the newest, and the report cannot say. A workshop of experienced technicians and one of recent joiners will look the same on revenue per head.
Outlets are compared without context
A small outlet and a large one are put on the same page with no allowance for mix.
Attrition is a single figure
The number says how many left, not who, where or when.
A better process
What a working version looks like
- 01
Join people and workshop data
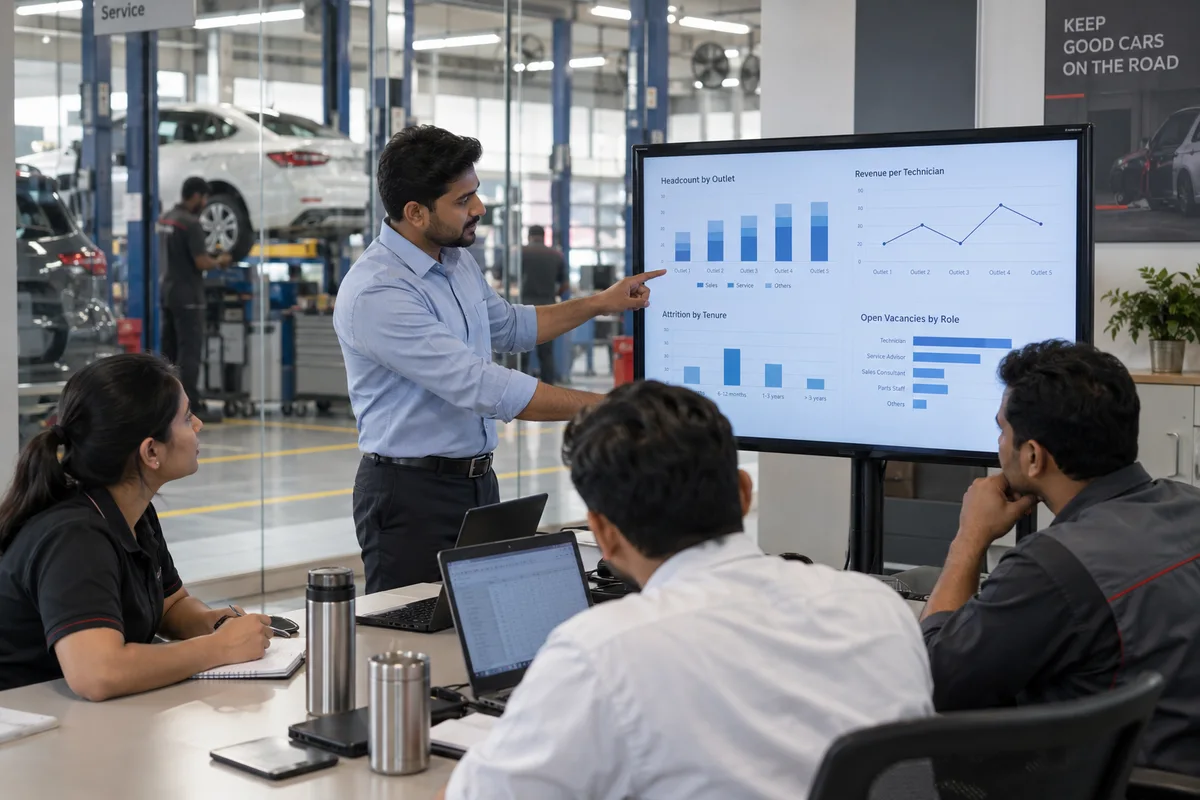
Technician tenure, attended hours, billed hours and rework per outlet, so productivity can be explained. The HR reporting and analytics work defines the join.
- 02
Report attrition by role and tenure
Show who leaves, from which outlet, after how long.
- 03
Compare like with like
Group outlets by size and mix, and compare within the group. Compare each outlet with its own previous quarter as well as with its peers.
- 04
Review the same few measures each month
A short page: headcount by outlet, attrition by role, productivity per technician, vacancies, certifications due.
What to check this week
- Ask for revenue per technician by outlet and see whether tenure can be added.
- Check whether attrition is shown by role and by months of service.
- Find how outlets are compared and whether size and mix are allowed for.
- Ask whether certifications due in the next quarter are listed anywhere.
- List the three questions the MD asks most and see whether a report answers each.
What this looks like in automotive
The parts of hr analytics and management reporting that are specific to this sector, rather than general.
Reporting Across a Group
Numbers that reconcile between plant and dealership.
What this coversHide
Reporting Across a Group
Numbers that reconcile between plant and dealership.
What this coversHideAutomotive groups struggle to answer basic questions about themselves because each location reports separately and nothing reconciles without a week of collection.
- Consolidated headcount by location, function and employment type
- Attrition by dealership, workshop and plant, compared
- Cost per head by location and function
- Sales staff productivity alongside attrition, viewed together
- Workshop technician utilisation and skill coverage
- Plant absenteeism and overtime by shift
- Recruitment cost and time to fill by location
- Group dashboard produced without manual assembly
Viewing sales attrition alongside productivity is the comparison that changes decisions, because high-performing dealerships with high attrition are a different problem from low-performing ones.
Questions on this, in automotive
A short set: headcount and cost, joiners and leavers, attendance and overtime, open vacancies, attrition by role and tenure, and certification expiry. We help you add productivity and training measures once the basics are reliable.
By using rates and ratios, such as per technician or per bay, and by showing tenure and mix next to the result. A newer or smaller outlet is then not judged against an older, larger one as if they were the same.
We map where each figure comes from and combine them in the pack, using exports or configured reports. Direct integration depends on the systems you use and is agreed separately.
Not necessarily. Many businesses are better served by a short monthly pack and a meeting. A dashboard becomes useful once definitions are stable and data arrives reliably.
Then the first output is a list of what cannot yet be measured and how to fix it. Reporting a few figures you trust is better than reporting many that you do not, and we will tell you which are which.
Yes, where the underlying records are held there. We configure the reports you have agreed, and where records are in other systems, we show you the best way to bring figures together.
Review it every quarter, remove what nobody used and add only what answers a real question. A pack that grows every month soon stops being read.
Headcount by outlet and role, attrition by role and tenure, productivity per technician with tenure, vacancies and certifications due. They show where people and money are being lost.
Group them by size and mix of sales and service, and compare within the group. A small outlet should not be set against the flagship.
Because the question is usually about the business, such as revenue per technician, and the answer is in how people are deployed. Separated, the data cannot answer it.
Monthly at group level, weekly at outlet level for vacancies and productivity. Frequent reviews catch problems while they are small.
See Your People Data Where It Matters
Tell us what you report today and what you would like to see, and we will propose a short pack.
Prefer to talk first? Call +91 80958 58589 or write to hello@gullyhr.com.
Book an HR Reporting Consultation
Tell us about your outlets and the reports you use now.
The general method — what hr analytics and management reporting covers, the questions it answers and what an engagement produces — is the same whatever the sector, and is set out on the hr reporting and analytics page. What is above is the part that differs for automotive.
To run this in a system rather than on paper, see reports, analytics and automation.
Other HR topics for automotive
Where to start
Most engagements begin with a review of how this runs in your business today, then a written process and the sequence to implement it.