
Give Plant and Group Heads One HR Pack They Can Read in Minutes
Ask three people the plant's headcount and you may hear three numbers: payroll staff, those on the floor today, or everyone including contract workers. We help you agree the definitions, choose the few measures that drive plant decisions, and produce a monthly pack that shows trends and not only levels. You decide what is measured and what the numbers mean. We build the definitions, the pack and the routine to produce it, in your own tools or on the GullyHR platform.
Not sure what you need? Tell us about your business in six short steps and we will come to the first meeting prepared.
Share your requirementsThe starting point
Does Everyone Quote a Different Headcount?
Plant managers get production figures every shift and HR figures only when someone compiles them. Without agreed definitions, the HR pack becomes a source of disagreement, and decisions go back to instinct.
We help you decide what to measure, define it once, and report it in a form that leads to decisions.
You may be experiencing:
- Headcount that differs between the plant, payroll and the head office.
- Absenteeism reported as a single number, with no split by line, shift or day of the week.
- Overtime hours visible in payroll but not in any report that production can act on.
- Attrition calculated differently by each plant.
- Reports that show this month's level without the trend behind it.
- A pack of many pages that nobody reads at the review meeting.
- Hours spent each month copying figures into a presentation.
What we can help with
Our HR Analytics and Reporting Services for Manufacturing
Measure Definitions
Write one definition for each measure, including headcount, absenteeism, overtime, attrition and training coverage, with the source, the formula and what is included or left out for contract workers.
Choosing the Few Measures That Matter
Ask each decision-maker which three decisions the pack should support, and keep only measures that serve them, so the pack stays short and useful.
Headcount, Cost and Movement
Report people by plant, line, shift and category, with joiners, leavers and transfers, and the cost of the workforce against output where you want to see it.
Attendance, Absence and Overtime
Show absence patterns by line, shift and weekday, and overtime hours by section against the gaps they cover, so supervisors and plant heads can act.
Hiring and Attrition Views
Report vacancies open, time to fill, early-weeks exits and attrition by tenure and skill group, using the single definition agreed for your plants.
Skills, Training and Safety Coverage
Report stations with trained cover, training completed against plan and safety records outstanding, linking people measures to production risk.
Plant Comparison for Groups
Present plants side by side on the same definitions, with notes on differences in product mix or shift pattern, so comparison is fair.
Reporting Cycle and Review
Set the dates for data to arrive, who prepares the pack, who reviews it and what actions are recorded, so the report feeds a monthly management review.
Working together
How the Work Can Be Set Up
Definitions and Pack Design
We agree measures and design the pack, and your team produces it.
Dashboard Build
We build the pack as a dashboard on the GullyHR platform or in your tool.
First-Cycle Support
We prepare the first few monthly packs with your team, then hand over.
The scope, who does what and the commercial terms are agreed before the engagement begins.
The deliverables
What You Receive
Depending on the agreed scope, you receive:
- A measures dictionary with definitions and sources.
- A monthly HR pack design for plant heads.
- A group view comparing plants.
- Headcount, absence, overtime and attrition views by line and shift.
- Hiring, training and safety coverage views.
- A reporting calendar with owners.
- A review meeting format with an action log.
- A dashboard set up in your tools or on the GullyHR platform.
Step by step
How We Work
Collect the Numbers People Quote
We gather the figures quoted at plant, payroll and head-office level and trace why they differ.
Agree the Definitions
We settle one definition for each measure with HR, finance and plant heads, and you sign it off.
Design the Pack Around Decisions
We draft a short pack with each reader, and drop anything they say they would not act on.
Produce and Compare Two Cycles
We prepare the pack for two months, check figures against source registers and refine the layout after use.
Hand Over and Baseline
We train your team to produce it, and record a baseline of hours spent compiling and figures in dispute, to report against.
The difference
Make the Numbers Worth Meeting About
A defined HR pack helps you:
We do not promise outcomes. We record a baseline before work starts, covering hours spent compiling the monthly figures, measures with more than one definition in use and figures disputed at review, and report against it, so you can see what changed and what did not.
- Quote one headcount in every conversation.
- See absence and overtime by line, not as a plant average.
- Spot a trend while it is still small.
- Compare plants on the same basis.
- Hold a review meeting on a page, not a sheaf.
- Cut the time spent assembling the report.
Find your fit
Who This Service Is For
Plant Heads Wanting Visibility
Managers who see production daily but HR only occasionally.
Group HR and Finance Teams
Teams comparing plants whose numbers do not match.
Owners Reviewing From a Distance
Management who oversee several sites from one office.
Plants Tackling Absenteeism or Overtime
Units that need data by line and shift to act.
HR Teams Compiling Reports by Hand
Executives who spend the early part of each month on figures.
How it usually shows up in manufacturing
Plant HR reporting is usually either missing or too long. The head of the plant hears the headcount in the morning meeting from production, and gets absence and overtime figures from the time office when asked. The monthly report, if there is one, is a long list of tables that nobody reads. The same measure is counted differently by different people: absenteeism with or without leave, overtime with or without approval, attrition with or without contract workers. Reports from different plants do not add up, so a group view requires a rebuild. Numbers arrive weeks after the month closes, too late to act on. Production-linked views, such as workforce cost per unit, absence by line or the skill coverage of each shift, are rarely produced. The information that would help most is held in the supervisor's notebook.
Common challenges
Where it goes wrong in manufacturing
Measures are counted differently
Absence, overtime and attrition mean something different to each person who reports them.
The pack is long and unread
Tables are produced for completeness and not for a decision.
Plants cannot be added up
Reports from each site use their own method, so the group view has to be rebuilt.
Numbers arrive too late
Figures reach the plant head weeks after the month ends.
A better process
What a working version looks like
- 01
Define each measure once
Headcount, absence, overtime, attrition and skill coverage: the formula, the data source and the owner, the same at every plant. The reporting and analytics work starts here.
- 02
Give the plant head a daily view
Present, absent and short by line and shift, available before the first shift settles.
- 03
Build a one-page monthly pack
Headcount and movement, absence and overtime by line, attrition by tenure, safety and training due, and open cases.
- 04
Link people numbers to production
Show workforce cost and absence against output so that a gap on the line is seen as a gap in the plan.
- 05
Set a reporting cycle and review
A date by which each number is ready, a monthly review of the pack and a record of actions.
What to check this week
- Ask two people how absenteeism is calculated and compare the answers.
- Look at the last monthly HR report and cross out what nobody uses.
- Compare the attrition figure from two plants for method.
- Check how soon after month end the figures arrive.
- Find whether overtime is shown against output by line.
What this looks like in manufacturing
The parts of hr analytics and management reporting that are specific to this sector, rather than general.
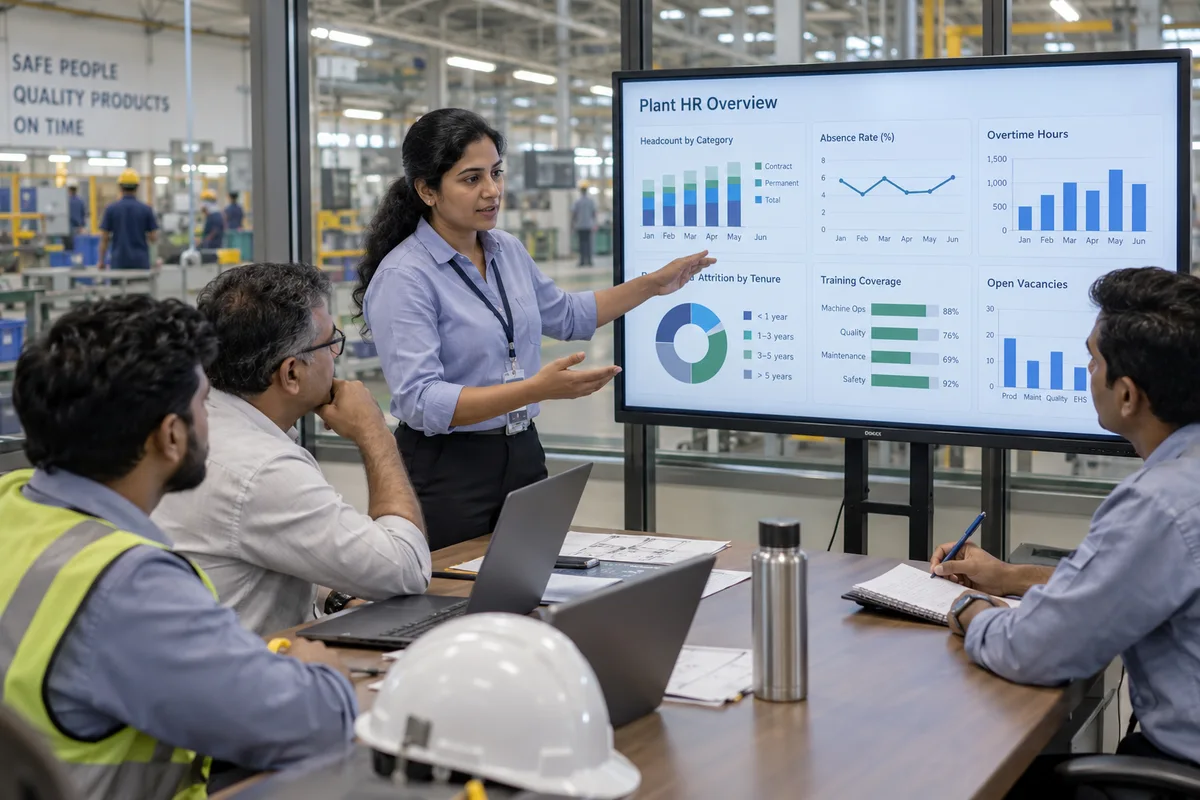
Plant HR Dashboard
What the plant head should see every morning.
What this coversHide
Plant HR Dashboard
What the plant head should see every morning.
What this coversHide- Headcount by department and shift
- Permanent vs contract
- Staffing against plan
- Absenteeism
- Late arrivals
- Overtime hours and cost
- Shift coverage
- Skill coverage on critical machines
- Open vacancies
- Attrition
- Training completion
- Incidents
- Employee cost per unit
Questions on this, in manufacturing
Separately and also in total. We suggest reporting payroll employees, contract workers and the combined floor strength, with each defined, so that nobody is confused about which figure is being discussed.
Not at first. A well-designed monthly sheet with agreed definitions is often enough. A dashboard helps once the definitions are stable and data flows from a system, and we can build one on the GullyHR platform.
Then the first report shows that, and it is useful. We tell you which measures can be relied on, which cannot yet, and what to fix in the records. We do not dress up weak data.
We do not offer predictions. We show patterns in your own records, such as where absence and exits concentrate, and you decide what they suggest. Reading a trend is not the same as forecasting an outcome.
Reports use aggregates wherever possible, with named detail limited to those who need it. Data protection obligations that apply to you should be confirmed with a qualified professional, as GullyHR does not give legal advice.
Monthly suits most plants, with a short weekly view for absence and overtime where those are pressing. We set the cycle with you so that data is ready before the review meeting and not during it.
Who is present, who is absent and which lines and shifts are short, with the skills missing. This is what changes the day's plan.
Decide whether it includes sanctioned leave, how partial days are counted and how contract workers are treated. Write it once and use it at every plant.
Headcount and movement, absence and overtime by line, attrition by tenure and shift, training and safety due, and open cases. One or two pages are enough.
Use the same definitions and the same cut-off dates, and report the same measures. Differences in work and size should be noted.
Because staffing gaps show up as lost output. Showing absence and overtime against output by line makes the cost visible to production leaders.
Agree the Numbers, Then Act on Them
Tell us which HR figures you rely on and where they disagree, and we will discuss a pack that supports the decisions your plant takes.
Prefer to talk first? Call +91 80958 58589 or write to hello@gullyhr.com.
Discuss Your HR Dashboard
Share who reads HR reports now and what they struggle with.
The general method — what hr analytics and management reporting covers, the questions it answers and what an engagement produces — is the same whatever the sector, and is set out on the hr reporting and analytics page. What is above is the part that differs for manufacturing.
To run this in a system rather than on paper, see reports, analytics and automation.
Other HR topics for manufacturing
Where to start
Most engagements begin with a review of how this runs in your business today, then a written process and the sequence to implement it.