
Ask What the Number Would Have to Show
Built for businesses whose records are patchy. Deciding what evidence would actually change a decision, pulling a usable comparison out of the registers you already keep, and being honest about what it does not prove.
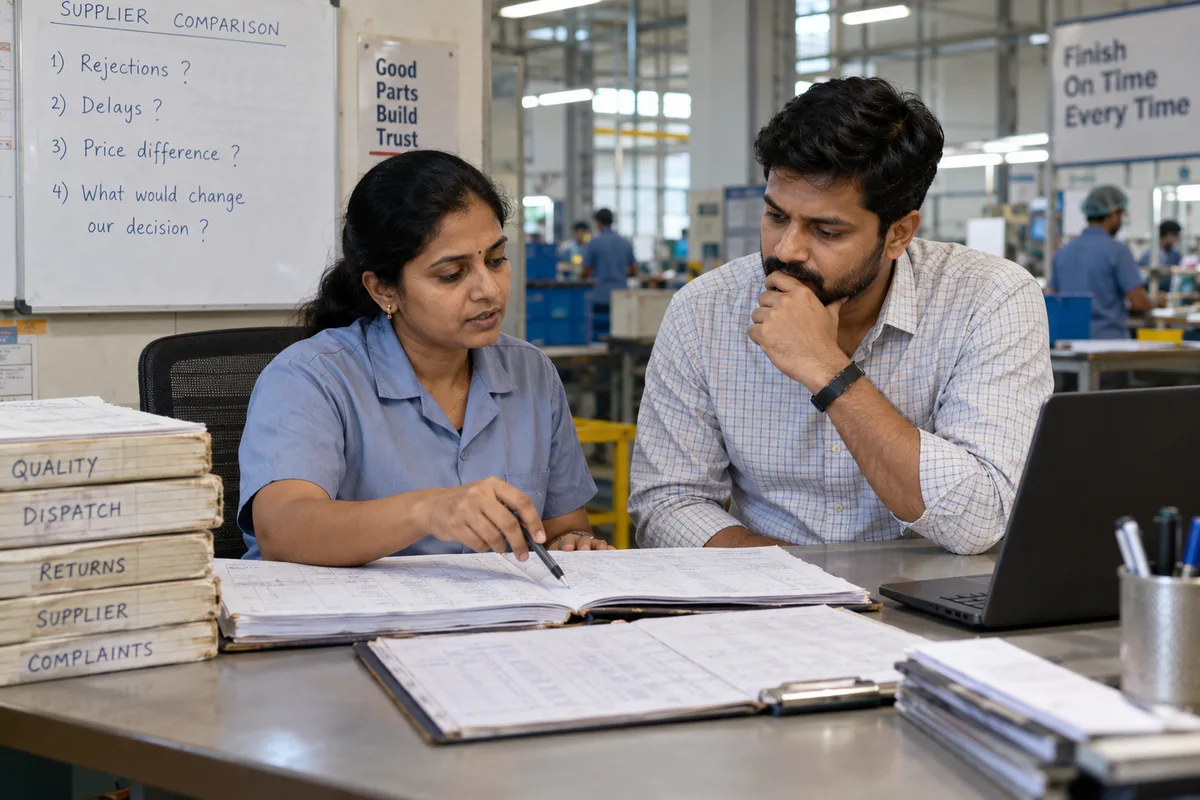
Most of This Data Lives in a Register, Not a Dashboard
You are deciding which of two suppliers to drop. The rejection figures sit in a quality register somebody fills in at the end of a shift, the delay history is scattered through a WhatsApp group, and the price difference is real but small. No dashboard is coming. So the useful question is not what the data says — it is what a number would have to show before you changed your mind. This session trains people to ask that first, then go looking.
What the Session Works On
Starting From the Decision, Not the Data
Name the decision, then write down what a figure would have to show to move it either way. Most requests for “more data” collapse at this step, because no plausible answer would have changed anything.
Working With What You Already Keep
The muster roll, the dispatch register, invoice dates, the complaint book, a group chat of shift updates. Pulling a usable comparison out of records that were never designed to be analysed.
How Sound Is This Number
Who recorded it, when, and what they were being judged on. A rejection figure kept by the person appraised on rejections is evidence of something, but not of what it appears to say.
Compared With What
Same month last year, the other shift, the other machine, the other branch. A figure on its own is not good or bad until it is set against something, and choosing that something honestly is the skill.
Averages That Hide the Problem
A comfortable average can sit on top of one customer who is served late every single time. Splitting a figure by customer, shift or line before trusting it.
The Bias That Survives a Spreadsheet
Confirming what the promoter already believes, reading a trend into a handful of readings, quietly dropping the month that spoils the story. Named in plain language, then caught in the group’s own analysis.
Putting It in Front of a Decision-Maker
One page: the decision, what the evidence supports, what it does not, and what you would still need to know. Practised in front of a deliberately sceptical audience.
What Participants Are Equipped to Do
Stop Asking for Reports Nobody Uses
Teams learn to ask for the one figure that would change the decision instead of commissioning a monthly report that gets filed unread.
Explain a Decision Months Later
The reasoning and the evidence behind a call are written down, so when it is questioned afterwards the answer is not “it felt right at the time”.
Say Plainly What the Evidence Does Not Cover
Stating the limits of a patchy record beats dressing a guess up in a chart, which is usually where a manager gets caught out.
Improve the Records Themselves
Once a team knows what would have changed the decision, it starts recording that. The register gets more useful because the question got sharper.
How GullyHR Runs It
Not a Statistics Course
No formulas, no software to learn, no new system to buy. Spreadsheets appear only where you already use them, and every exercise is a business decision rather than a maths problem.
We Assume Your Data Is Messy
Because it usually is. The exercises use incomplete and inconsistent records on purpose, since incomplete records are what your people will have in front of them on Monday morning.
Your Own Registers Where You Allow It
Where you can share them we work from your actual records, de-identified. Where you cannot, we build the exercises to match how your records are kept.
A Decision Brief on a Real Question
A one-page decision brief they have written on a real question from your business, and a short checklist for interrogating any figure someone puts in front of them.
Start From the Decision You Are Stuck On
Tell us the call you cannot make with the records you have, and we will build the session around it.
Questions We Get Asked
No. Nothing beyond a spreadsheet, and often not even that. The programme trains judgement about numbers, not tools.
It is the opposite — that is the situation the programme is written for. The first thing participants learn is how to decide with incomplete evidence and how to state what is missing, which matters more when there is no dashboard to hide behind.
No. This is training, not an analytics or reporting implementation, and no system is built or configured during it. If what you actually need is a reporting setup, we will say so at the scoping stage instead of selling you a session that will not deliver one.
Both, and preferably in the same room. The manager who asks for a figure and the person who compiles it need the same understanding of what the figure is for; training them separately usually leaves the gap exactly where it was.